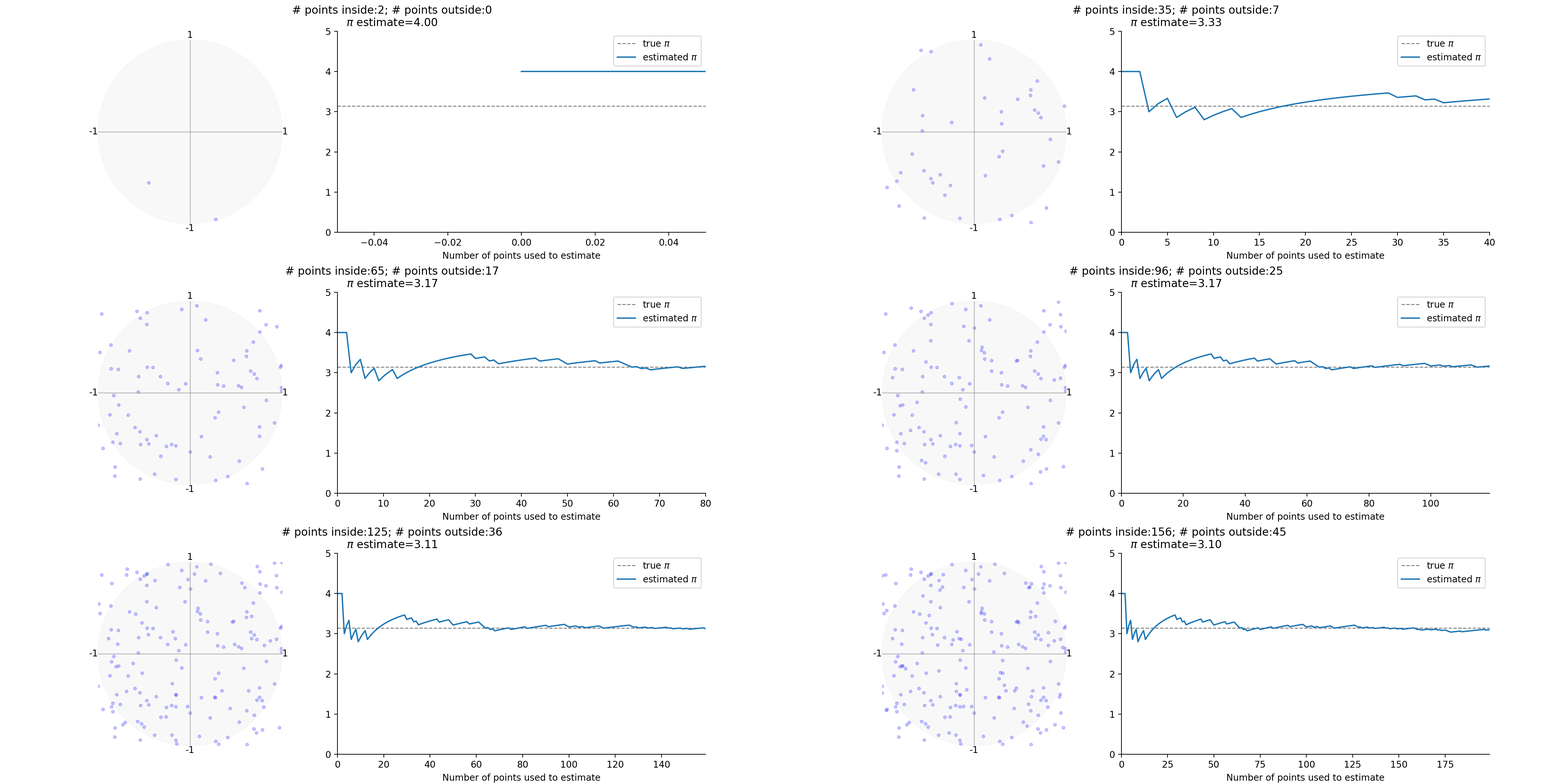
Estimate pi using Monte Carlo simulation

Original post
- In the original post, I used numpy to estimate $\pi$. This is done by generating a random list of points having x and y coordinates in the range [-1, 1] and counting the numbers of points that fall inside circle with radius 1 centered at point (0, 0).
- The ratio of the number of points in the circle to the total number of points can be used to estimate the area of the circle, which is pi.
- Though using numpy was efficient, it feels.. boring.
import numpy as np
np.random.seed(99)

# Set the number of random points to generate
num_points = 1000000

# Generate random x and y coordinates in the range [-1, 1]
x = np.random.uniform(-1, 1, size=num_points)
y = np.random.uniform(-1, 1, size=num_points)

# Calculate the distance of each point from the origin
r = np.sqrt(x**2 + y**2)

# Count the number of points that fall within the unit circle
num_points_in_circle = np.sum(r <= 1)

# Estimate the value of pi using the ratio of the areas of the circle and the square
pi_estimate = 4 * num_points_in_circle / num_points

print(pi_estimate)
# >>> 3.141328
Adding animation
This code generates an animation that estimates the value of pi using a Monte Carlo method. The animation consists of two subplots, the left plot shows the random points generated, and the right plot shows the estimated value of pi as the number of generated points increases.
Imports
import random
import matplotlib.pyplot as plt
from matplotlib.animation import FuncAnimation
from itertools import count
import math
random.seed(42)
Use itertool.count iterators to keep track of whether points are inside or outside the unit circle
num_point_inside = count()
num_point_outside = count()
current_estimate = []
Prepare the base plots for the animation. Most of the customizations are my own preferences.
# prepare base plots
# most of the settings are aesthetics
fig, ax = plt.subplots(1, 2, figsize=(12, 4), width_ratios=[1,2])
ax[0].set_aspect('equal', 'box')
ax[0].set_ylim(-1, 1)
ax[0].set_xlim(-1, 1)
ax[0].hlines(y=0, xmin=-1, xmax=1, ls='-', lw=1, color='grey', alpha=.5)
ax[0].vlines(x=0, ymin=-1, ymax=1, ls='-', lw=1, color='grey', alpha=.5)
ax[0].axis('off')
ax[0].text(1, 0, ha='left', va='center', s=str(1))
ax[0].text(0, 1, ha='center', va='bottom', s=str(1))
ax[0].text(-1, 0, ha='right', va='center', s=f'-{1}')
ax[0].text(0, -1, ha='center', va='top', s=f'-{1}')
ax[0].set_facecolor('#f0f0f0')

circle = plt.Circle((0, 0), 1, alpha=.5, color='#f3f3f3')
ax[0].add_patch(circle)
ax[0].set_xlabel('Generate random points')
ax[1].set_xlabel('Number of points used to estimate')

for spine in ['top', 'left', 'right', 'bottom']:
    ax[0].spines[spine].set_visible(False)

ax[1].axhline(y=math.pi, ls='--', lw=1, color='grey', label='true $\pi$')
ax[1].set_ylim(0, 5)
line, = ax[1].plot([0], [0], label='estimated $\pi$')
ax[1].legend()

for spine in ['top', 'right']:
    ax[1].spines[spine].set_visible(False)
Define atomic functions. These are self-explanatory except for animate()
calc_distance_from_originto calculate distance of a point from origin (0, 0).is_point_inside_circlecompare distance with 1update_countupdates the corresponding iteratorget_current_countis a workaround to access the iterator’s current valueanimategets called by FuncAnimation repeatedly to update the plot. In this function, I generate random points. Based on that, update both count iterators and the plot figure.
def calc_distance_from_origin(x_coord, y_coord):
    return (x_coord**2 + y_coord**2) ** .5


def is_point_inside_circle(x_coord, y_coord):
    distance = calc_distance_from_origin(x_coord, y_coord)
    if distance <= 1:
        return True
    return False


def update_count(x_coord, y_coord, num_point_inside, num_point_outside):
    if is_point_inside_circle(x_coord, y_coord):
        next(num_point_inside)
    else:
        next(num_point_outside)


def get_current_count(iter):
    """
    itertools.count() doesn't have method to access current value
    using repr()
    """
    return int(repr(iter)[6:-1])


def get_current_pi_estimate(count_in, count_out):
    """
    area of circle = pi * r^2  = pi * 1^2 = pi
    area of square = 2^2 = 4
    num point inside / total ~ pi / 4
    pi = num point inside * 4 / total
    """
    cnt_points_inside = get_current_count(count_in)
    cnt_points_outside = get_current_count(count_out)

    if cnt_points_inside + cnt_points_outside == 0:
        _estimate = 0

    else:
        _estimate = 4 * cnt_points_inside / (cnt_points_inside + cnt_points_outside)

    return _estimate


def animate(frame_num):
    # frame_num = current frame number
    # we don't need to use this variable, but it's needed for FuncAnimation

    # generate new points
    x_coords = random.uniform(-1, 1)
    y_coords = random.uniform(-1, 1)
    update_count(x_coords, y_coords, num_point_inside, num_point_outside)

    # update ax[0]
    ax[0].scatter(x_coords, y_coords, s=10, color='blue', alpha=.20)

    # updated ax[1]
    _current_estimate = get_current_pi_estimate(num_point_inside, num_point_outside)
    current_estimate.append(_current_estimate)
    line.set_data(list(range(len(current_estimate))), current_estimate)
    ax[1].set_xlim(0, frame_num)

    # update text
    fig.suptitle(f'# points inside:{get_current_count(num_point_inside)}; # points outside:{get_current_count(num_point_outside)}\n$\pi$ estimate={_current_estimate:.2f}')
Run the animation and save to .mp4
ani = FuncAnimation(fig, animate, frames=200, interval=1, repeat=False)
ani.save('animation.mp4', fps=60)