Analyzing my poker games
Introduction
During covid group gathering restrictions, my friend groups moved our board game sessions online, including poker (thanks pokernow.club). The game also provided log data in csv format for each hand. I always wanted to find out what the winning players are doing differently, and hopefully improve my game.
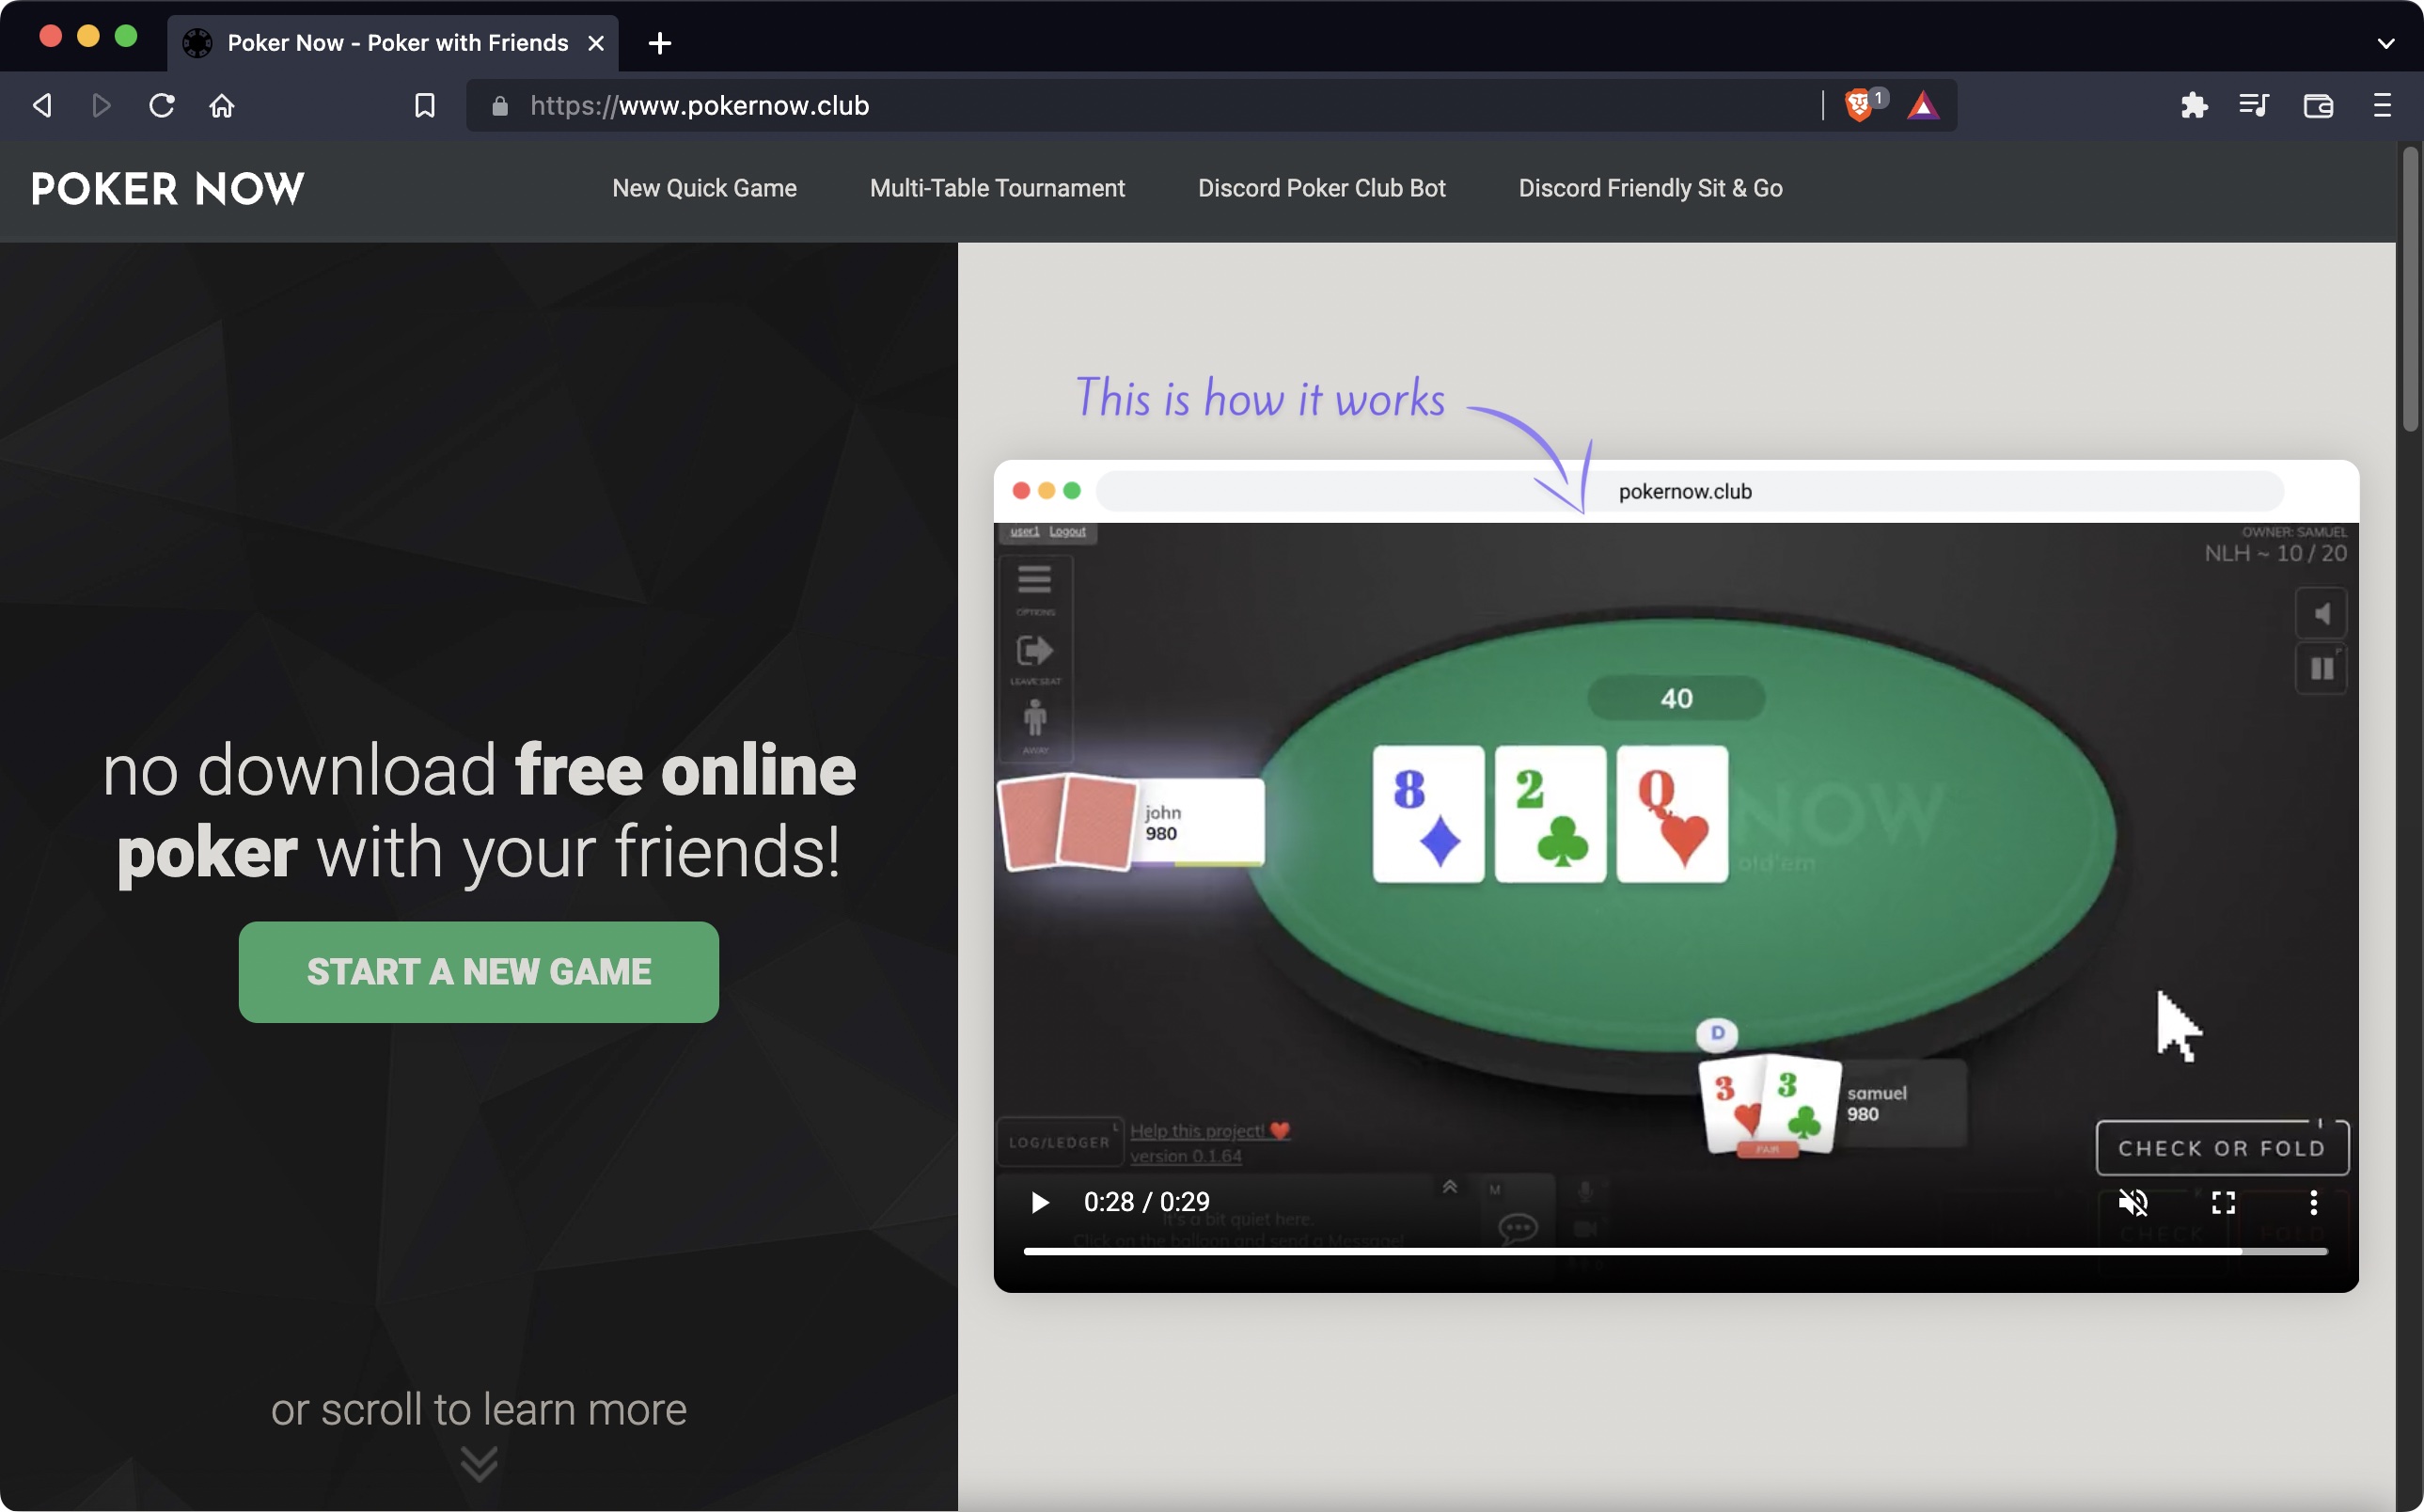 Where I used to hang out during lockdown
Raw data
A sample hand in the game log looks like below. The 1st column contains the log details (player names, action, value). The 2nd column contains timestamp. At first glance, there are a a lot of details. However, we will need to do some data pre-processing before we can start analyzing.
Is the game fair?
Since the game’s Random Number Generator is a blackbox, we wanted to make sure that the cards dealt are fair. One way to verify this is by looking at flopped cards and plot their distributions. We can extract all flops by grepping lines containing “flop”
> ls
# raw_data.csv

> grep -i flop raw_data.csv
# "Flop:  [3♦, Q♠, 7♥]"...
# "Flop: [...
As we moved from offline to online, we were able to play a lot more hands as there’s no time need to shuffle and deal out the cards. That’s when we also started to observed patterns that didn’t exists! (eg. confirmation biases for perceived higher frequencies of certain cards combinations).
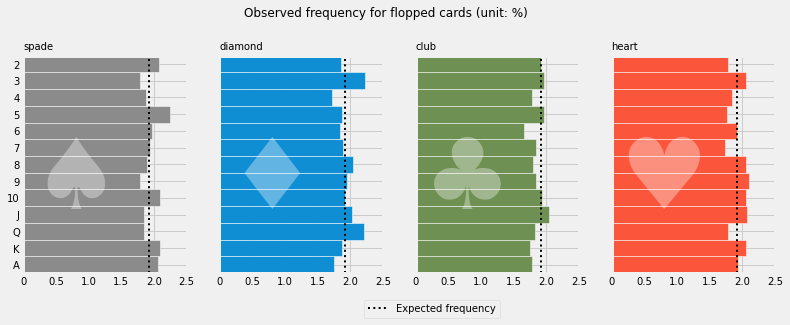
I conductde a Chi-squared goodness-of-fit test and the observed frequencies are not statistically significant. Game was fair.
The above method would work similarly for Turns and Rivers. The full code can be found here
How did we play as a group?
Pot sizes
fig, axes = plt.subplots(1,2, figsize=(10, 6))
pot_sizes = df.groupby('hand_id')['pot_size'].max().sort_values(ascending=False) / 0.20


pot_sizes.to_frame().hist(ax=axes[0], ec='white', bins=25)
axes[0].set_title('Raw pot size distribution')
axes[0].set_ylabel('Number of hands')
axes[0].set_xlabel('Big blinds')

np.log10(pot_sizes).to_frame().hist(ax=axes[1], ec='white')
axes[1].set_title('log(pot size) distribution')
axes[1].set_ylabel('Number of hands')
axes[1].set_xlabel('log(Big blinds)')

fig.suptitle('Median pot size is about 10^1.5 ~ 31 x BB')
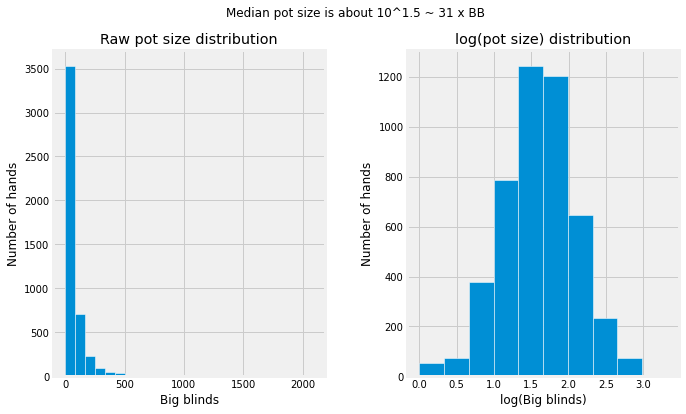
The left chart (raw pot sizes) shows that the distribution is heavily skewed. It’s easier to use log of pot size (right chart) and see that the median pot value is around 30x BB (~10**1.5)
At which phases are the hands won?
fig, ax = plt.subplots()
ax.clear()
df.loc[df['action']=='Won'].groupby('hand_id')['phase'].max().value_counts(dropna=False, ascending=True).plot(ax=ax, kind='barh', width=1, ec='white')
ax.set_title('At which phases are hands won?')
ax.set_ylabel('Phase')
ax.set_xlabel('Number of hands')
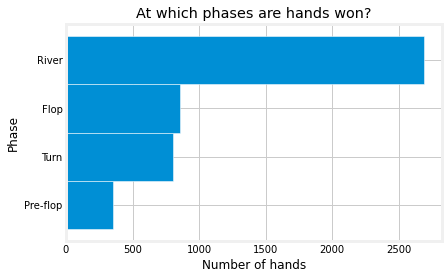
Judging from the result, we can conclude that the game was pretty casual as it often went to River. My hypothesis is that good players have better evaluation of their hands strength, hence they can make decisions earlier (eg. folding earlier). Meanwhile, at a lower stake game, player don’t lose much in terms of dollar value hence it’s ok to commit to the hand for longer.
We can verify this by comparing hand end phase vs. a higher stake game.
Player’s behaviors
Next we analyze player’s behavior, which is the goal of the analysis. Though the raw file contains all the information we need, we it needs some processing before we can find any insights.
- Player names can be matched with Regex pattern
" (.+) @ [A-Za-z0-9\-]" - Possible actions are
posts a small/big blind,folds,calls,checks,bets,raises - To identify player’s VPIP (Voluntary Put money In Pot) and PFR (Pre-flop Raises), we will need to distinguish between voluntary action (bets/raises/calls) vs non-voluntary actions (blinds/checks) which say nothing about the player’s choice.
The full data prepocessing can be found in this notebook
Overview: Number of hands played, Winnings, Win per hand
By itself number of hands played only shows how many hands the players sit in. But will be useful to calculate the various playstyle metrics below.
We can make a reasonable assumption that, given enough hands, the better players win more. Next we will analyse different patterns of behaviors. Hopefully we can learn from the winners here.
# pl = player dataframe to store all metrics
pl = df.loc[(df['phase']=='Pre-flop') & (df['rank-P0']==1)]['player_name'].value_counts(dropna=False).to_frame(name='num_hands_played')
_expenses = df.groupby('player_name')['put_in'].sum()
_expenses.name = 'total_expenses'


_income = df.loc[df['action']=='Won'].groupby('player_name')['_amount'].sum().sort_values()
_income.name = 'total_income'

pl = pl.merge(_income, left_index=True, right_index=True)
pl = pl.merge(_expenses, left_index=True, right_index=True)

pl['win/hand'] = (pl['total_income'] - pl['total_expenses']) / pl['num_hands_played']

pl.sort_values(by='win/hand', ascending=False).head(5)

fig2, axes = plt.subplots(1, 3, figsize=(12, 3.5), sharey=True)
pl = pl.sort_values(by='num_hands_played')
pl15 = pl[-15:]
pl15['num_hands_played'].plot(ax=axes[0], title='Num hands played', kind='barh', width=1, ec='white')
(pl15['total_income'] - pl15['total_expenses']).plot(ax=axes[1], title='Net win (no. of BB)', kind='barh', ec='white', width=1)
pl15['win/hand'].plot(ax=axes[2], title='Win per hand (no of. BB)', kind='barh', ec='white', width=1)
axes[0].set_ylabel('player id')
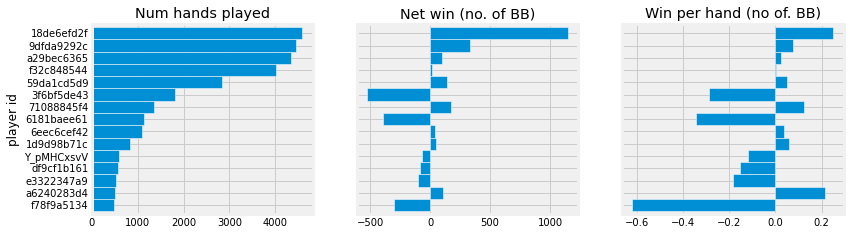
From this chart we can see that ..6efd2f is a good player. We should try to find out how he/she plays!
VPIP: Voluntarily Put In Pot & PFR: Pre-flop Raises
VPIP tracks the percentage of hands in which a particular player voluntarily puts money into the pot preflop. VPIP increases when a player could fold but instead commits money to the pot preflop. This includes limping (merely calling the big blind), calling, and raising.
PFR tracks the percentage of hands in which a particular player makes a preflop raise when having the opportunity to fold or call instead. This includes reraises. By definition, PFR is a subset of VPIP. So we will plot the ratio PFR/VPIP to measure player’s tendency.
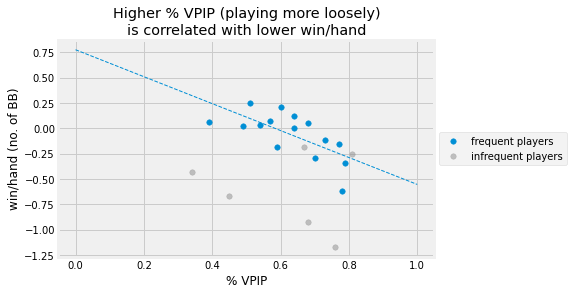
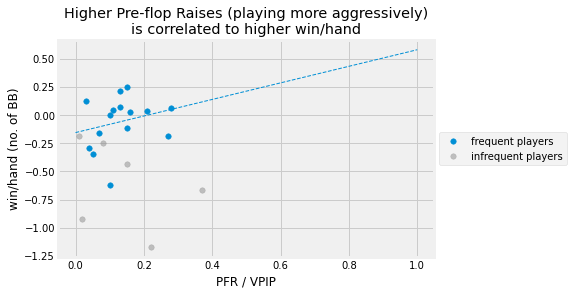
It’s clearer now that the winning players play fewer hands (lower % VPIP). But when they play, they are more aggressive with raisings!
Takeaways
-
Some of the results are not surprising based on common knowledge (play fewer hands, and more aggressive). However, it’s one thing to read and memorize the theory. But to see how the game plays out really convinced me to adjust my game and hopefully obtain better results.
-
Since our games are casual and not meant to make money, I expect most of my friends to not stick strictly to the theoretically correct way of playing. Hence, only aggregating the data as above might not be the best method. Instead, I can also identify the biggest pots played and analyze them more closely. This will definitely contain more useful insights into each player’s playstyle.