Analyzing Vietnam's high school graduation exam results
0. Introduction
-
The Vietnamese high school graduation exam, also known as the National High School Exam, is a standardized test taken by high school students in Vietnam. It is used to determine whether students have achieved a sufficient level of knowledge and skills in order to graduate from high school and is considered a crucial factor in their future academic and career prospects. The test covers subjects such as mathematics, literature, physics, chemistry, biology, history, and geography.
-
The scores are public, and is semi-anonymised. From this dataset, I will:
- Identify general trends across the subjects
- Predict missing scores
- Answer whether it’s fair to give bonus scores to students in less developed areas
import pandas as pd
import numpy as np

import matplotlib.pyplot as plt
import seaborn as sns

from scipy import stats

import xgboost as xg
from sklearn.model_selection import train_test_split
from sklearn.metrics import mean_squared_error as MSE
pd.set_option('display.max_rows', 100)
sns.set_theme(style='white')

df = pd.read_csv('data/processed/yr2019.csv') # main score dataset
gdp = pd.read_csv('data/processed/grdp_per_cap.csv') # to find correlation between income level and academic performance

df.head()
| candidate_ID | literature | mathematics | fl_code | foreign_language | physics | chemistry | biology | history | geography | civics_study | province | |
|---|---|---|---|---|---|---|---|---|---|---|---|---|
| 0 | 1000029 | 5.00 | 7.2 | N1 | 6.8 | 6.0 | 4.5 | 4.00 | NaN | NaN | NaN | Ha Noi |
| 1 | 1000030 | 6.25 | 6.2 | N1 | 8.0 | 5.0 | 4.5 | 3.75 | NaN | NaN | NaN | Ha Noi |
| 2 | 1000031 | 5.75 | 6.8 | N1 | 7.2 | NaN | NaN | NaN | 4.25 | 5.5 | 7.0 | Ha Noi |
| 3 | 1000032 | 4.50 | 5.8 | N1 | 9.0 | NaN | NaN | NaN | 7.00 | 6.5 | 7.0 | Ha Noi |
| 4 | 1000033 | 5.50 | 7.0 | N1 | 3.6 | NaN | NaN | NaN | 5.25 | 7.5 | 8.5 | Ha Noi |
subjects = [
 'literature',
 'mathematics',
 'foreign_language',

 'physics',
 'chemistry',
 'biology',

 'history',
 'geography',
 'civics_study',]
1. Overview of subjects and scores
df_long = pd.melt(
    df,
    id_vars=['candidate_ID', 'province'],
    value_vars=subjects,
    var_name='subject',
    value_name='score'
).dropna()
df_long.head()
| candidate_ID | province | subject | score | |
|---|---|---|---|---|
| 0 | 1000029 | Ha Noi | literature | 5.00 |
| 1 | 1000030 | Ha Noi | literature | 6.25 |
| 2 | 1000031 | Ha Noi | literature | 5.75 |
| 3 | 1000032 | Ha Noi | literature | 4.50 |
| 4 | 1000033 | Ha Noi | literature | 5.50 |
fig1, axes1 = plt.subplots(1, 2, figsize=(12, 6), sharey=True)

# count of students
subject_count = df[subjects].notnull().sum()

sns.barplot(
   x=subject_count.values,
   y=subject_count.index,
   palette="vlag",
   ax=axes1[0],
)

# distribution of scores per subject
sns.boxplot(
    x=df_long['score'],
    y=df_long['subject'],
    showfliers=False,
    palette="vlag",
    ax=axes1[1],
    showmeans=True,
    meanprops={"marker":"o",
                       "markerfacecolor":"white",
                       "markeredgecolor":"black",
                      "markersize":"8"})

for ax in axes1:
    sns.despine(ax=ax, left=True, bottom=True)

    for val in range(len(subjects)):
        ax.axhline(y=val + .5, color='grey', ls='--', alpha=.5)

axes1[0].set_title('Number of students signing up for each subject', loc='left', fontweight="bold")
axes1[0].set_xlabel('Number of students')
axes1[1].set_title('Distribution of scores obtained\nCircles show averages', loc='left', fontweight="bold")
axes1[1].set_ylabel(None)
axes1[1].set_xlabel('Score out of 10')

fig1.tight_layout()
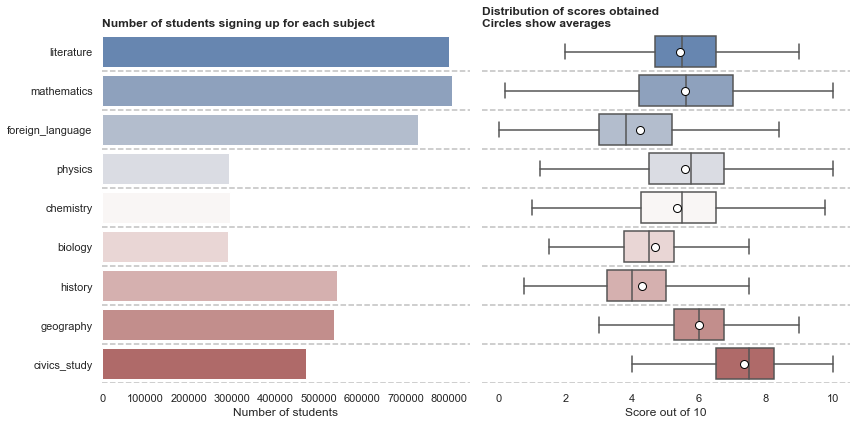
Subject choices:
- The compulsory subjects are Maths and Literature, and for most students, a Foreign Language. Among these subjects, students struggle the most with Foreign Language where the median student scored less than half of total points.
- The Natural Science subjects (Physics, Chemistry, Biology) are less popular than Social Sciences (History, Geography, Civics Study)
Scores:
- Maths scores spread out the most. This does a good job of ranking students. Furthermore, Maths’ means and median are very close. Nice!
- Civics study has the highest average score. On one hand, it’s hard to ask difficult questions on this subject as it mostly concern with how one can be a ‘good’ citizen. On the other hand, it might not be a good subject to evaluate students. I would recommend a simple Pass/Fail score for this subject.
2. Finding correlation between subjects and Predicting missing scores
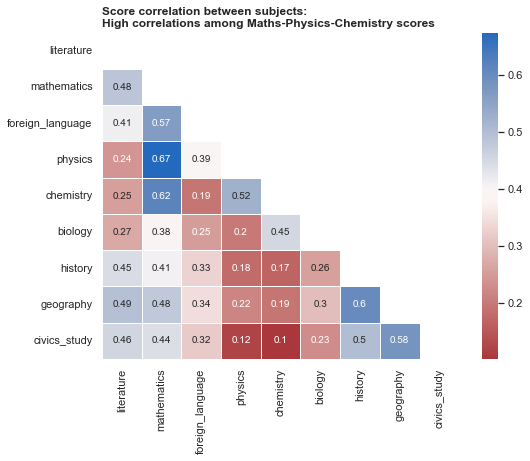
- Generally, we can assume that a student who do well in a subject (such as Maths) might likely also do well in other (eg. Physics or Chemistry). As the skills required (logical thinking, being hardworking) are similar.
-
We can use this knowledge to make predictions. For example: predict Maths scores based on other subjects.
- Beyond simple predictions, we can find more subtle patterns. In extreme cases, we might even identify cheating students if their scores deviate too much from expected. However, this is a serious topic that require additional data (eg. students’ and their schools’ performance across time, etc) so we will not try to do so here based solely on a snapshot of limited data.
Correlation matrix
scores = df[subjects]
scores.head()
| literature | mathematics | foreign_language | physics | chemistry | biology | history | geography | civics_study | |
|---|---|---|---|---|---|---|---|---|---|
| 0 | 5.00 | 7.2 | 6.8 | 6.0 | 4.5 | 4.00 | NaN | NaN | NaN |
| 1 | 6.25 | 6.2 | 8.0 | 5.0 | 4.5 | 3.75 | NaN | NaN | NaN |
| 2 | 5.75 | 6.8 | 7.2 | NaN | NaN | NaN | 4.25 | 5.5 | 7.0 |
| 3 | 4.50 | 5.8 | 9.0 | NaN | NaN | NaN | 7.00 | 6.5 | 7.0 |
| 4 | 5.50 | 7.0 | 3.6 | NaN | NaN | NaN | 5.25 | 7.5 | 8.5 |
corr_matrix = scores.corr()
corr_matrix.round(2)
| literature | mathematics | foreign_language | physics | chemistry | biology | history | geography | civics_study | |
|---|---|---|---|---|---|---|---|---|---|
| literature | 1.00 | 0.48 | 0.41 | 0.24 | 0.25 | 0.27 | 0.45 | 0.49 | 0.46 |
| mathematics | 0.48 | 1.00 | 0.57 | 0.67 | 0.62 | 0.38 | 0.41 | 0.48 | 0.44 |
| foreign_language | 0.41 | 0.57 | 1.00 | 0.39 | 0.19 | 0.25 | 0.33 | 0.34 | 0.32 |
| physics | 0.24 | 0.67 | 0.39 | 1.00 | 0.52 | 0.20 | 0.18 | 0.22 | 0.12 |
| chemistry | 0.25 | 0.62 | 0.19 | 0.52 | 1.00 | 0.45 | 0.17 | 0.19 | 0.10 |
| biology | 0.27 | 0.38 | 0.25 | 0.20 | 0.45 | 1.00 | 0.26 | 0.30 | 0.23 |
| history | 0.45 | 0.41 | 0.33 | 0.18 | 0.17 | 0.26 | 1.00 | 0.60 | 0.50 |
| geography | 0.49 | 0.48 | 0.34 | 0.22 | 0.19 | 0.30 | 0.60 | 1.00 | 0.58 |
| civics_study | 0.46 | 0.44 | 0.32 | 0.12 | 0.10 | 0.23 | 0.50 | 0.58 | 1.00 |
# remove the top triangle of the matrix to simplify the heatmap
mask = np.zeros_like(corr_matrix, dtype=bool)
mask[np.triu_indices_from(mask)] = True

# plot
fig2, axes2 = plt.subplots(figsize=(8, 6))

sns.heatmap(
    corr_matrix,
    mask=mask,
    annot=True,
    linewidth=.5,
    cmap = sns.color_palette("vlag_r", as_cmap=True),
    ax=axes2
    )

axes2.set_title('Score correlation between subjects:\nHigh correlations among Maths-Physics-Chemistry scores', loc='left', fontweight="bold")
Text(0.0, 1.0, 'Score correlation between subjects:\nHigh correlations among Maths-Physics-Chemistry scores')
Predicting Math score based on other subjects
We will use xgboost regression as it works well with tabular data
scores_nonnull = scores.dropna(subset='mathematics')

X = scores_nonnull.drop('mathematics', axis=1)
y = scores_nonnull['mathematics']


# Splitting
train_X, test_X, train_y, test_y = train_test_split(X, y, test_size = 0.3, random_state = 123)


# Instantiation
xgb_r = xg.XGBRegressor(objective ='reg:squarederror', n_estimators = 10, seed = 123)


# Fitting the model
xgb_r.fit(train_X, train_y)


# Predict the model
pred = xgb_r.predict(test_X)

# RMSE Computation
rmse = np.sqrt(MSE(test_y, pred))
print(f'RMSE : {rmse:.3f}')
RMSE : 0.998
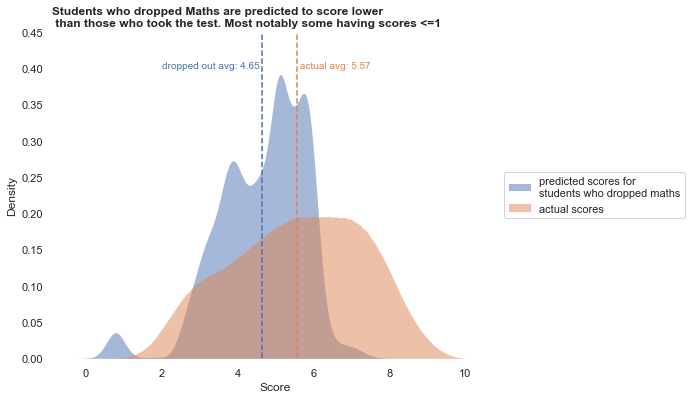
Using the fitted model, we can predict Math scores for those who didn’t take the test.
# predicting scores of students who dropped maths
missed_maths = df.loc[df['mathematics'].isnull()][subjects].drop(['mathematics'], axis=1)

missed_maths_pred = pd.DataFrame({'predicted': xgb_r.predict(missed_maths)})

missed_maths_pred.head()
| predicted | |
|---|---|
| 0 | 6.494553 |
| 1 | 5.275107 |
| 2 | 3.323812 |
| 3 | 5.175710 |
| 4 | 2.715799 |
actual_mean = scores_nonnull['mathematics'].mean()
dropped_mean = missed_maths_pred['predicted'].mean()
fig3, axes3 = plt.subplots(figsize=(8,6))

sns.kdeplot(
   data=missed_maths_pred, x="predicted",
   fill=True,
   alpha=.5, linewidth=0,
   label='predicted scores for\nstudents who dropped maths',
   ax=axes3
)

sns.kdeplot(
   x=scores_nonnull['mathematics'],
   fill=True,
   alpha=.5, linewidth=0,
   label='actual scores',
   ax=axes3
)

sns.despine(ax=axes3, left=True, bottom=True)
axes3.set_title('Students who dropped Maths are predicted to score lower\n than those who took the test. Most notably some having scores <=1', loc='left', fontweight="bold")
axes3.set_xlabel('Score')

axes3.axvline(x=dropped_mean, ls='--', color=sns.color_palette().as_hex()[0])
axes3.text(x=dropped_mean, y=0.4, ha='right', s=f'dropped out avg: {dropped_mean:.2f} ', color=sns.color_palette().as_hex()[0])
axes3.axvline(x=actual_mean, ls='--', color=sns.color_palette().as_hex()[1])
axes3.text(x=actual_mean, y=0.4, ha='left', s=f' actual avg: {actual_mean:.2f} ', color=sns.color_palette().as_hex()[1])
axes3.set_ylim(top=.45)

axes3.legend(loc='center left', bbox_to_anchor=(1, 0.5))
<matplotlib.legend.Legend at 0x17fb30ee0>
3. Is it fair to give bonus points for less developed regions?
- Students from less developed regions are given bonus scores. Reason is that they can devote less time to study compare to their peers in wealthier regions. A bonus score gives them with better opportunity for a good univerity education and improve their prospects.
- This practice is only fair if students from poorer areas indeed perform worse.
- We can validate this by comparing score distributions between 2 regions (similar to an A/B test). In this example I compare between Ha Noi (~5,000 USD per cap) and Nghe An (~1,500 USD per cap)
# avg score per province
prov = df.pivot_table(
    index='province',
    values=subjects,
    aggfunc=np.mean
).reset_index()

prov = prov.merge(gdp, how='left', left_on='province', right_on='provinces')
prov.head().round(2)
| province | biology | chemistry | civics_study | foreign_language | geography | history | literature | mathematics | physics | provinces | grdp (million usd) | population | grdp/cap | |
|---|---|---|---|---|---|---|---|---|---|---|---|---|---|---|
| 0 | An Giang | 5.08 | 5.49 | 7.92 | 4.71 | 6.44 | 4.84 | 5.92 | 5.89 | 5.63 | An Giang | 3226.8 | 1908352 | 1690.88 |
| 1 | Ba Ria Vung Tau | 4.60 | 5.34 | 7.66 | 5.11 | 6.05 | 4.30 | 5.34 | 6.11 | 5.66 | Ba Ria Vung Tau | 6496.1 | 1148313 | 5657.08 |
| 2 | Bac Giang | 4.84 | 5.62 | 7.57 | 4.07 | 6.17 | 4.43 | 5.53 | 5.45 | 5.88 | Bac Giang | 3772.7 | 1803950 | 2091.36 |
| 3 | Bac Kan | 4.92 | 5.22 | 7.52 | 3.70 | 6.10 | 4.54 | 5.24 | 4.39 | 5.17 | Bac Kan | 427.2 | 313905 | 1360.92 |
| 4 | Bac Lieu | 5.22 | 5.48 | 7.86 | 4.33 | 6.33 | 4.77 | 6.02 | 5.86 | 5.63 | Bac Lieu | 1638.2 | 907236 | 1805.70 |
fig4, axes4 = plt.subplots(figsize=(8, 6))

sns.scatterplot(
    data=prov,
    x='grdp/cap',
    y='mathematics',
    size='population',
    legend=False,
    color='#3c76aa',
    alpha=.75,
    ax=axes4
)

axes4.axvspan(1000, 2500, color='#fcba03', alpha=.25, zorder=-1, ec='None')


axes4.set_title('Strong positive correlation between GDP per cap and Maths score\nup until 2,500 USD/person level', loc='left', fontweight="bold")

sns.despine(ax=axes4, left=True, bottom=True)
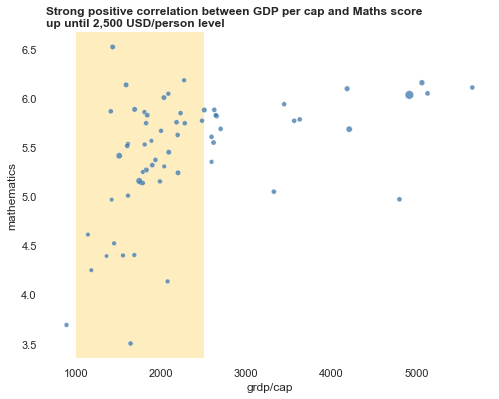
- From 0 to around 2,500 USD/cap, we see a very strong positive relation between GRDP and Maths score. But above 2,500 USD/cap the trend is flattende.
- This implies that after a certain standard of living is achived, score is less impacted by wealth. At this point, basic education costs (books/tuitions) are covered. And other factors impact more.
print(f"Ha Noi avg Maths: {df[(df['province']=='Ha Noi')]['mathematics'].mean():.2f}")
print(f"Nghe An avg Maths: {df[(df['province']=='Nghe An')]['mathematics'].mean():.2f}")
Ha Noi avg Maths: 6.03
Nghe An avg Maths: 5.41
Hypothesis testing of 2 population means
- Null hypothesis: 2 provinces have identical averages
- Alternative hypothesis: 2 provinces have different averages
hanoi_math = df[(df['province']=='Ha Noi')]['mathematics'].dropna()
nghean_math = df[(df['province']=='Nghe An')]['mathematics'].dropna()

stats.ttest_ind(
    a=hanoi_math,
    b=nghean_math,
    alternative='greater',
    )
Ttest_indResult(statistic=50.43617963341244, pvalue=0.0)
Since p-value < 0.05, we reject the null hypothesis. Our sample data favor that students in Ha Noi indeed perform better than Nghe An.
At the moment, it still make sense to support students from less developed regions. However, as shown in the chart, upon reaching certain GRDP level, students’ scores stop improving. Therefore, in order to ensure fairness, it will require policymaker to monitor the pace of development and make adjustments accordingly.
References
- Bonus scores based on region. https://huongnghiep.hocmai.vn/diem-uu-tien-la-gi-tat-tan-tat-ve-cach-tinh-diem-uu-tien-xet-tuyen-dai-hoc/